131 km² of the Tuwaiq escarpment drains past the plot
Shuaib Muzairah gathers its water from the high ground to the west and south-west and runs past the plot's north-east corner, about 50 m away, then on to Al-Muzairah dam 1.9 km downstream.
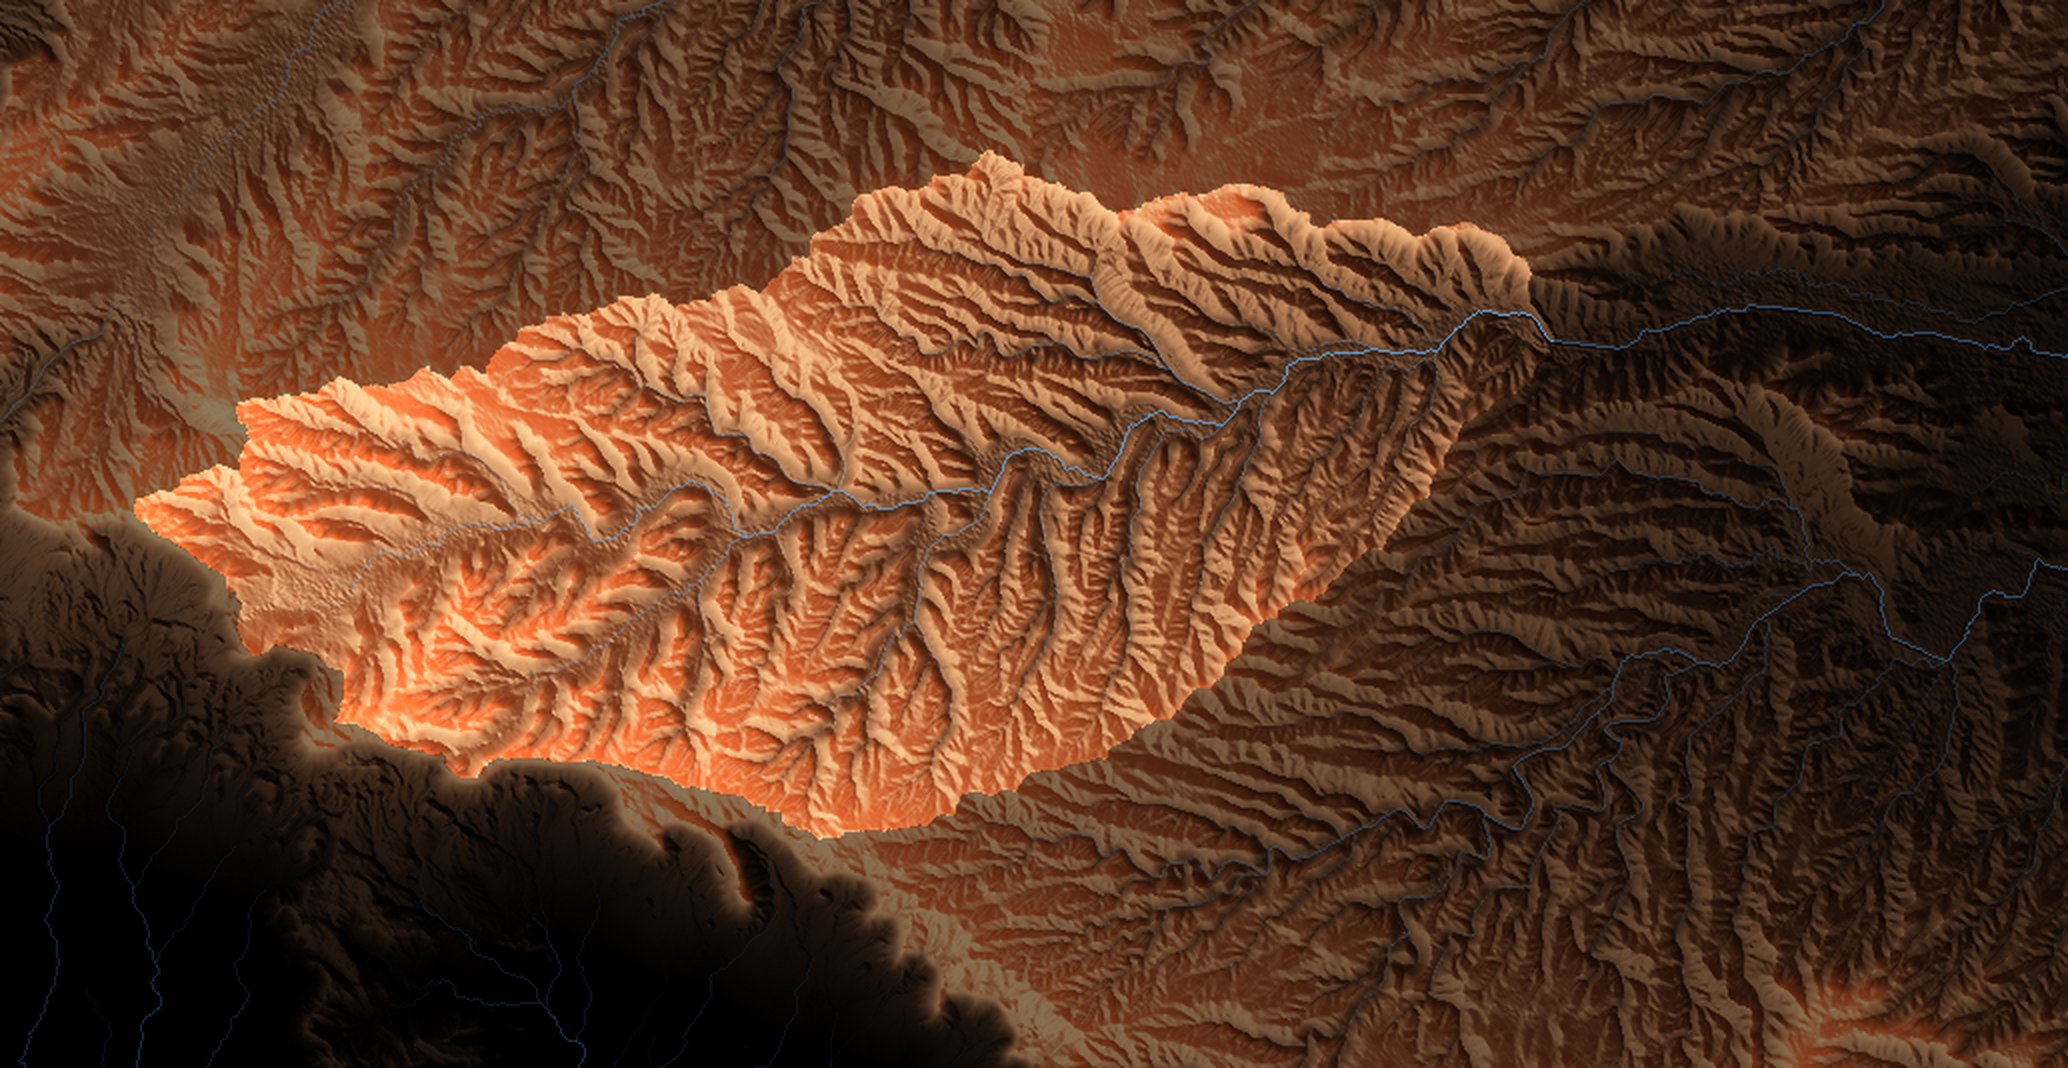
Where the water goes in a storm
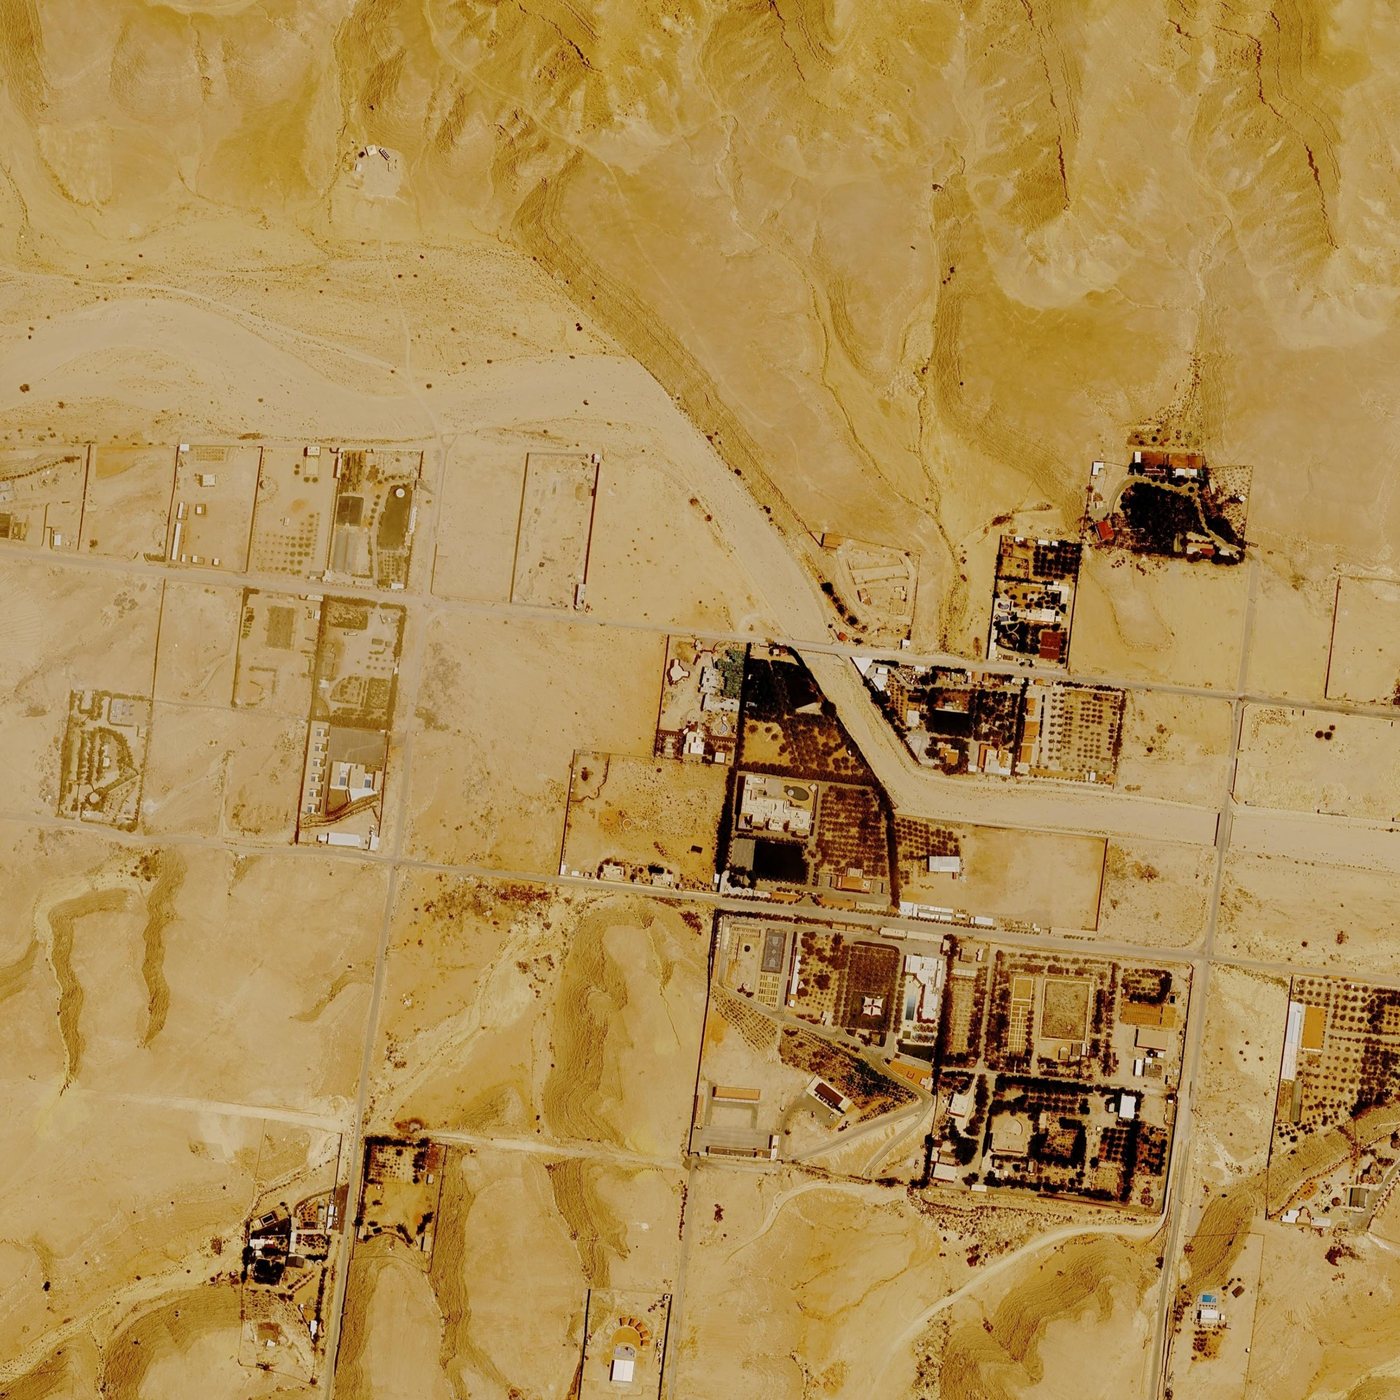
The catchment turns each storm into a flood coming down the wadi; a 2D model then spreads it over the ground round the plot. The wadi's west bank overflows at the bend north-west of the plot, and a shallow sheet of water crosses the open ground to the plot's north, west and south-west.
Twenty-three years of Google Earth
Google Earth has pictured the site 21 times since 2003. Slide through them: under each, the heaviest rain since the picture before.
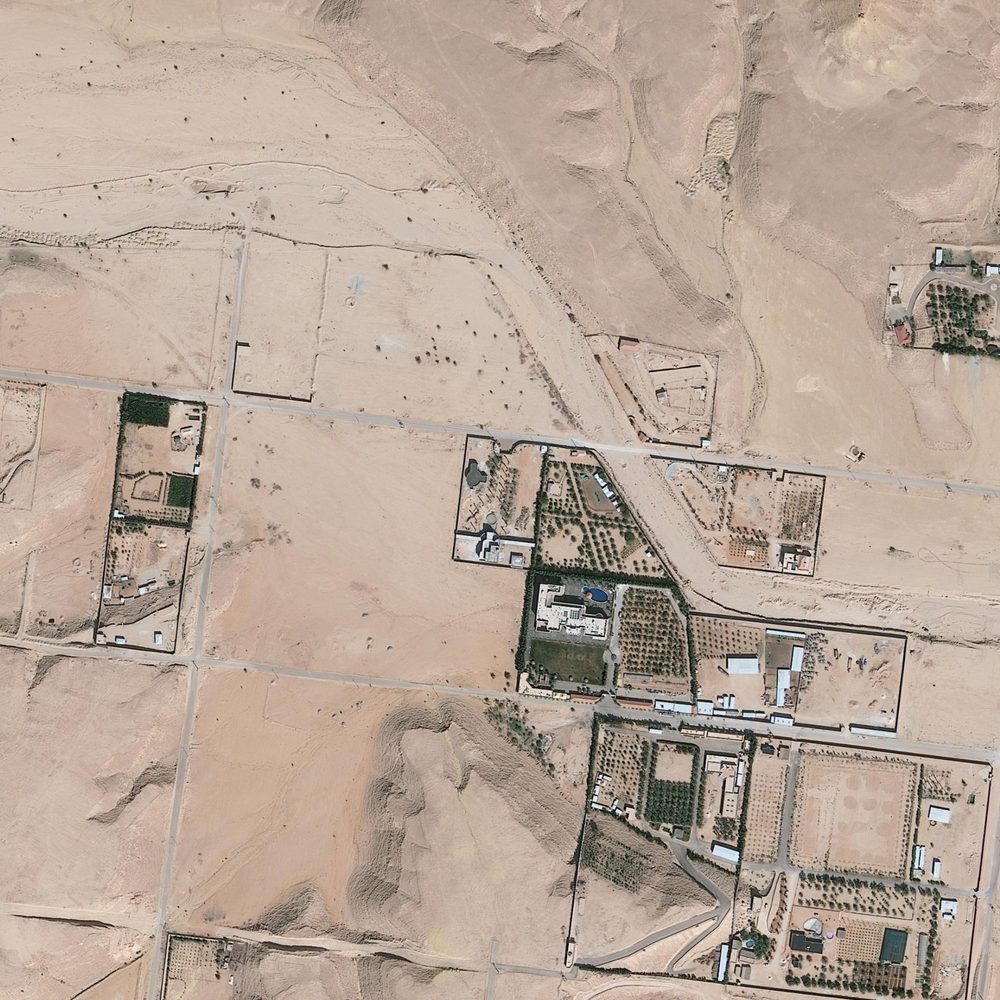
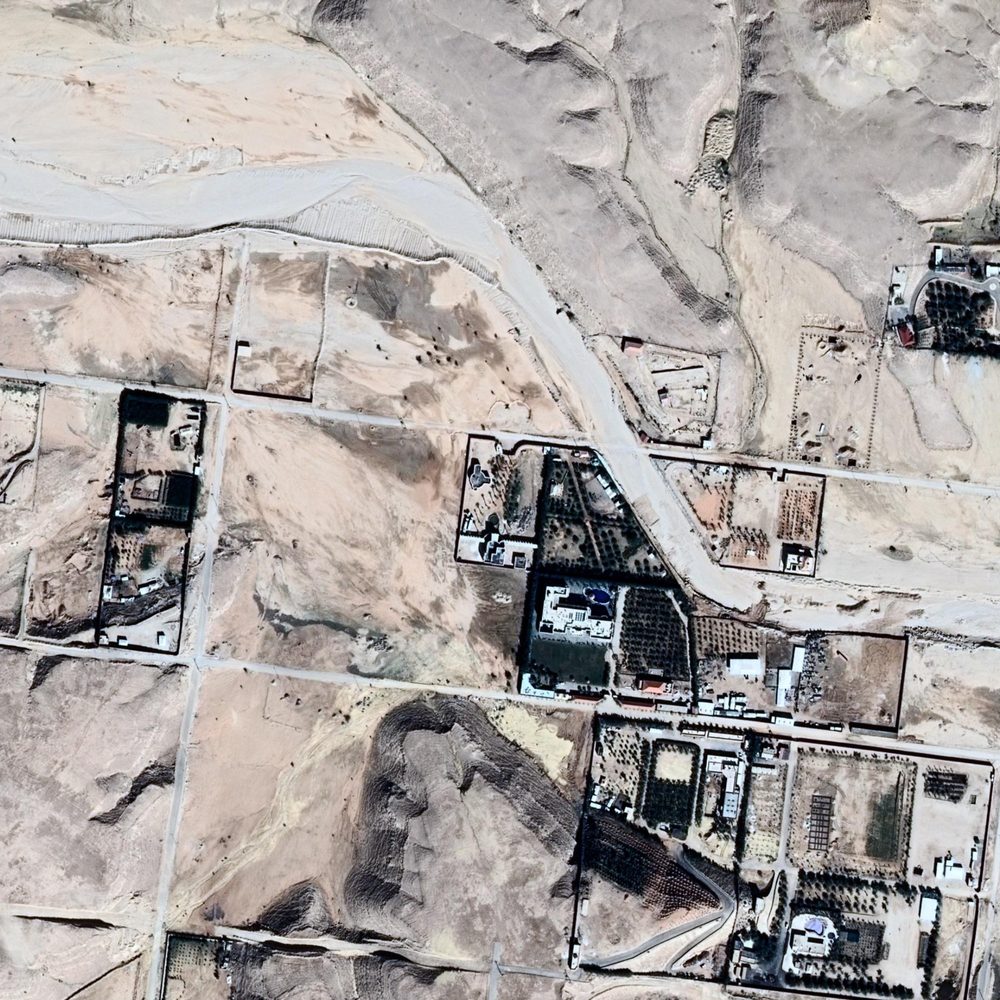 2013-02-122014-01-12
The channel north-east of the plot is freshly scoured, and the ground to its west is stained where water spread. Between the two pictures: the Riyadh floods of 16 to 19 November 2013, and 31 mm on 6 January 2014, six days before the second.
The dam downstream is a rain gauge nobody installed
A 570 m earth embankment across the same wadi, 1.9 km downstream. Each picture with water behind it shows the wadi ran.
86 years of the wettest days
No rain gauge stands at the site. Two free records cover it: ERA5 from 1940 and NASA POWER from 1981. Both average rain over cells tens of kilometres wide, so a storm over the escarpment falls harder than they show.
Wet ground after rain, from Sentinel-2
Wet ground darkens in short-wave infrared. Comparing the picture just before a rain with the one just after shows where water ran: blue is ground that got wetter than the scene as a whole. 6 km round the plot.
How far to trust it
For anything built on these numbers, such as gate thresholds, drains or a wall's footing, a civil engineer should check them with a level survey and the Ministry's design rainfall for Riyadh.